
Tableau is one of today’s most popular tools to analyze business data. We’ve used Tableau ourselves in many cases to help us make informed decisions on complex issues. Most of us finds understanding problems exponentially easier when you can visualize the data. Especially problems who lends itself to multiple sources, where you need to combine sets of data and see them as one.
In the following post we’ll discuss a simple alternative to getting your manufacturing test data into Tableau. So that you can combine it with data from other sources.
An alternative who does not need you to invest a huge number of hours to get operational, and that features important metrics such as True First Pass Yield
And will help you carry out best-practice approaches to Continuous Improvement.
Tableau for EMI – various sources of data
Enterprise Manufacturing Intelligence (EMI) and Business Intelligence does not limit itself to segmented problems. But rather looks to improve all aspects of manufacturing and business.
Meaning the sources of data are many.
With distinct and varying characteristics. Test data from electronics manufacturing is one type. Data that in itself contains high-value insight. But also can be enriched with related contextual data.
Related sources of data here includes, among others
- Manufacturing Execution Systems (MES)
- Enterprise Resource Planning (ERP)
- Quality Management Systems (QMS)
- Product Lifecycle Management (PLM)
- Customer support systems, like Zendesk.
As you are reading this post you probably have an interest in using Tableau to unify and make sense of such multi-origin data. To help ask and answer the right questions in your company. And you want to know how manufacturing test data and First Pass Yield metrics fits into the picture.
If that is the case, read on.
Prerequisites for Analyzing Test Data in Tableau
It’s easy to assume that uploading raw test data to Tableau is simple. In essence, it is just some measurements, along with pass/fail information and some pieces of meta data. However, test data can unfortunately be very “dirty” and unstructured compared to other sources of data. That in turns leads to problems when you try to aggregate this information throughout your company. A solution to effectively analyze your manufacturing test data in Tableau, at least requires following:
- Can collect data from any test process, including from subcontractors
- Can automate the collection of test reports
- Have one standardized format of all your test data, or
- Are able to convert all your different test formats to one common
- Have a solution to host the raw data and the processed data
- Can post-process what test steps initially cause a test run to fail (all others might be collateral failures)
- Provides both a statistical lens, as well as a unit-specific lens
- Can facilitate a well-thought-out process for continuous improvement
- Does all the above in compliance with your IT policy

Combining Off-the-Shelf solutions with customized Tableau
At the end of the day, what you really are attempting to do is probably not to build applications. Unless you intend to sell it for profit at least. But rather to enable you to unify data from within your specific software stack. To better assist on solving your specific problems.
The fact that these problems are specific to you does not mean that their characteristics are unique. That you need unique solutions for them.
The benefits with commercial solutions are often that they can generalize problems in a way that lets you turn the focus away from
- “How do we find of design a tool that can adapt to our unique existing processes?”, over to
- “How to we facilitate our operational processes to follow best-practices?”
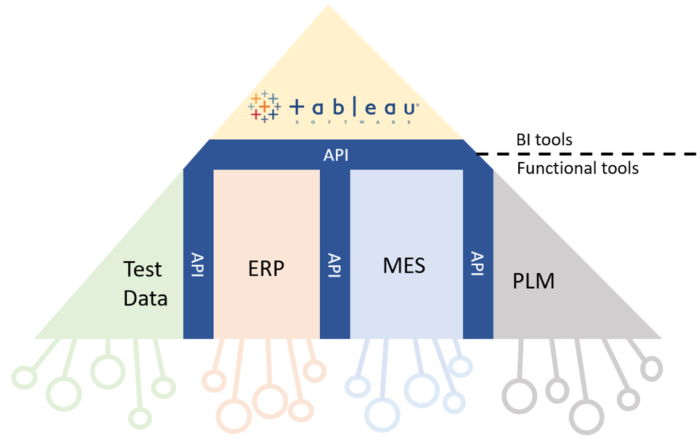
Most likely, your top-level EMI solution in reality will end up being somewhat proprietary. Due to the uniqueness of your software stack. But this rarely is the case at the lower functional levels.
You likely have the same type of problems as the rest of your industry.
Meaning that you should focus your customization efforts to the top of the pyramid, at the Business Intelligence level. And leverage integrated off-the-shelf solutions towards the bottom, at the functional level.
Solutions that helps you adopt best-practices at their level of functional expertise.
Using API for integration
Obviously, you will need solutions that provides a certain level of integrability to construct your hierarchy. In general, there is one category of software that provides the highest degree of plug-and-play integrations and access to public APIs (for instance a RestAPI).
Those categorized as Software-as-a-Service (SaaS).
Solutions that only exists as local installations typically are laggards when it comes to open integrations. And you end up tying your success rate up with the vendors feature-roadmap priorities. If you’re a Fortune 500 company that can justify paying for this priority; good for you. If not, this will likely turn out to be a severely limiting factor.
Integrations between SaaS solutions
The integration “upwards” to Tableau is obviously important, to allow you to fully investigate the interesting broader questions.
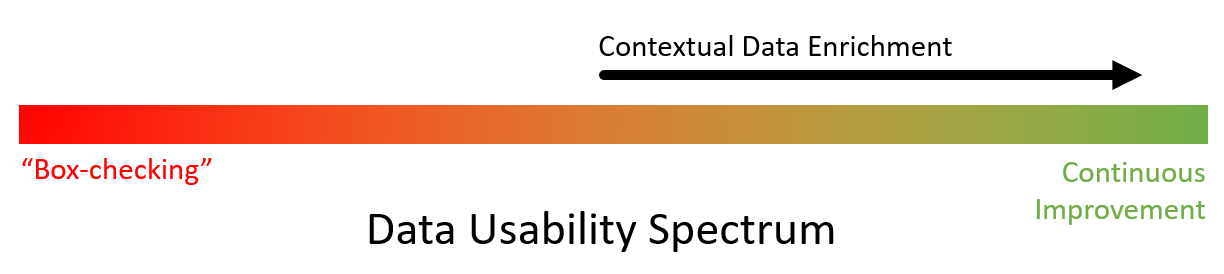
But it is equally important that you can integrate between the lower-level functional solutions. A key reason is improvement of the quality of your data, through data-enrichment and contextualization.
A simple example is a product that gets repaired, like through an operator interface in the MES system. The MES system then needs access to the test data in order to know what failing test it is repairing for. It also needs access to the Bill-of-Material information that lives in the ERP system. So you can evaluate the performance of your components.
Unless you have all of this information the integrity of the repair data is poor. It will remains on the “box-ticking” side of the Data Usability Spectrum. Simply because it lacks important context.
Without any elements of such “cross-system” context, the value that you can expect to get from this data at the higher level using Tableau is also greatly reduced.
Integrating WATS to Tableau and other functional solutions
WATS is a Manufacturing Intelligence SaaS solution designed to help electronics production. It provides turn-key features for all of the data mining needs discussed earlier in this post. It also provides a rich set of analytics features. To help you ask and answer important questions related to the performance of your manufacturing. Important metrics such as
- First Pass Yield
- Frequent failure Pareto
- Process capability analysis
- Time-tracking metrics
- Asset Maintenance status
To name a few. WATS also has a RestAPI to integrate with other software solutions, as well as upwards towards Tableau and other BI tools such as Microsoft Power BI.
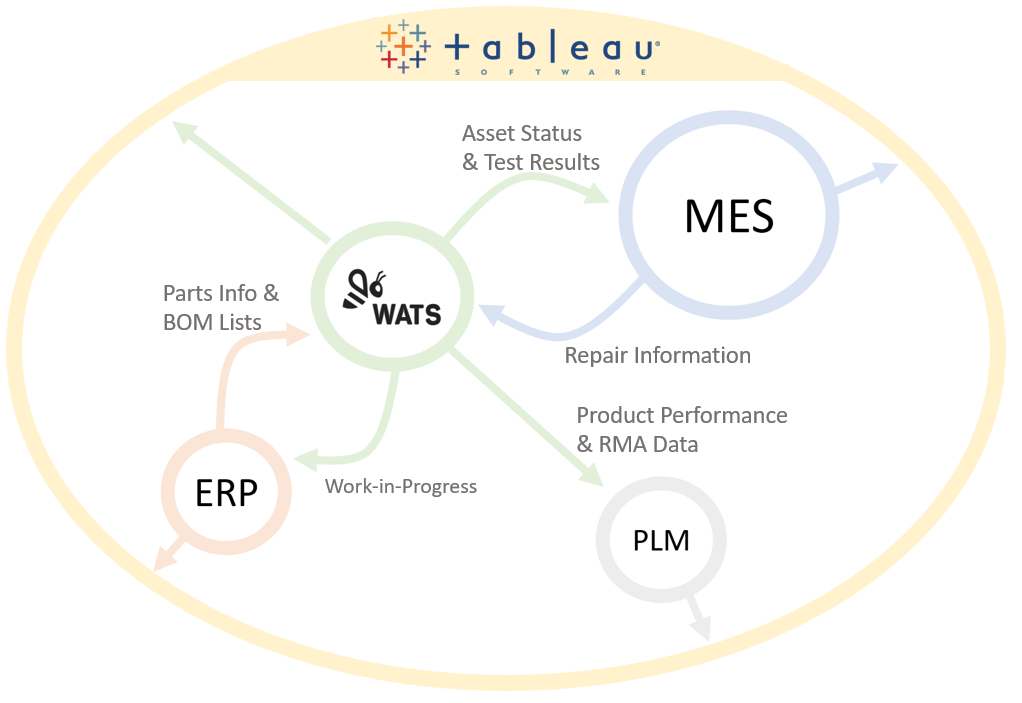
Some of the most common integrations with WATS include
- Direct integration to Automated Test Systems (ATEs)
- Importing Bill-of-Material from ERP system
- Exchange of unit parent-child information to/from MES or ERP system
- Integrating WATS Work-In-Progress information to inventory management system
- Checking for serial-number validity from ERP system
- Passing on test records to Repair system (WATS also features a native repair-operator interface)
- Integrating with Microsoft 365 for Single-Sign-On
Keep focus on core activities
When possible you should default to standard solutions for these functional components of your customized EMI setup. Simply because you are then able to retain a significant part of your operational bandwidth to focus on your core activities.
Your theoretical calculations might show that a custom minimal-viable-solution can come at a lower cost. But there are a great number of unknown factors in these kinds of project. That easily will often spin the cost out of control, along with helping you to accumulate a huge technical debt on the project.
Remember, regardless of the actual problems you wish to address, there is one thing all have in common. That the system should help you do things better tomorrow than what you do today.
Such sought improvements could be a reduction in warranty claims, lower manufacturing scrap, fewer labor-hours per product, improved bandwidth of existing test equipment, and so forth.
If your focus is on building tools you end up taking the foot of the pedal on the operational improvements. The improvements that are the actual intention with building up your software stack.
If you are interested in evaluating how WATS can help you make better sense of your manufacturing test data, and how you can use the RestAPI to integrate with Tableau, please sign up for a free trial.
