When it comes to getting value from your test data, how you choose to interact with it, it is just as important as what the content of the data is. Traditional Quality Management Software and Statistical Process Control often limit its applicability to detailed monitoring of a few key parameters in a product. This methodology might help detect severe quality breaches before a product is shipped out. However, it fails significantly when it comes to facilitating cost-optimization and Continuous Improvement.


A top-down approach
WATS enables a top-down approach for working with your test data, an approach that is superior for Continuous Improvement and Total Quality Management. Any pass/fail information is aggregated up to a global True First Pass Yield metric through a series of meta-data categories. Categories such as locations, products, revisions and more. Users can then easily identify the categories where failures most frequently occur, prioritize properly and spend their resources investigating these.
Detect failures where they are introduced
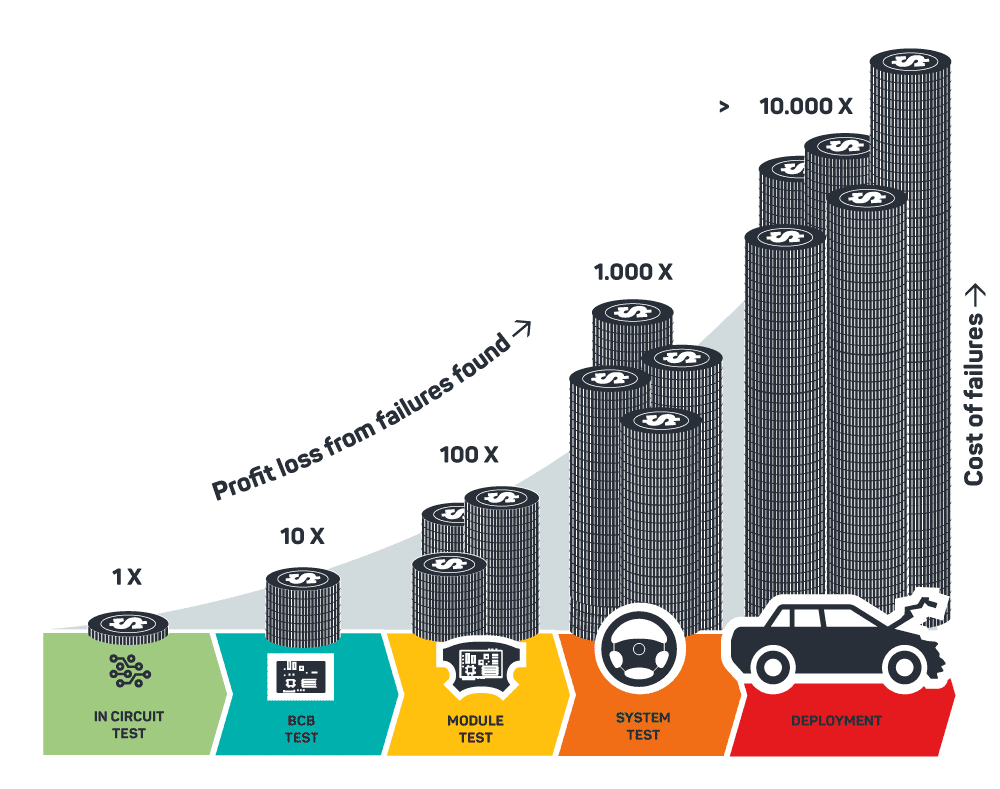
An important source of data in WATS’ top-down is all the various test processes a finalized product goes through. Each one is a potential source of failures, and each one is a potential candidate for poor-test coverage. The 10x Cost Rule of Manufacturing tells us that the cost of fixing an early failure grows exponentially for each step it is allowed to pass in the manufacturing process. So a proper continuous improvement implementation must let you detect the failures where their symptoms first appear and fix them there.
Learning through the lifecycle
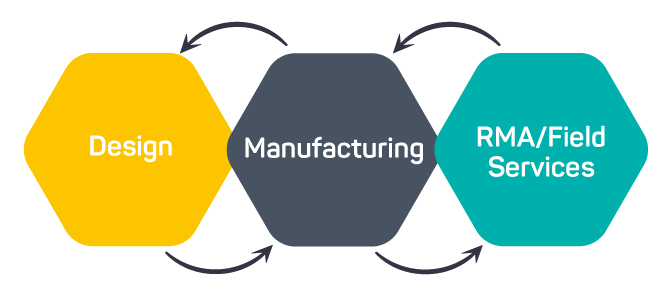
A key benefit of this top-down approach is also that you can effectively prioritize improvement initiatives based on frequency and severity, vs the efforts needed to fix them. By combining test data analysis with RMA and Repair data analysis, your insights are at the next level. A level where you can directly link the symptoms detected in manufacturing testing, to some of the most costly activities that an OEM carries responsibility for.
Book a Demo with us today
Get a deep dive on how WATS work and discover how easy our platform is to use. Learn how WATS can access your test data and give you a real-time overview of your manufacturing.
Book Demo