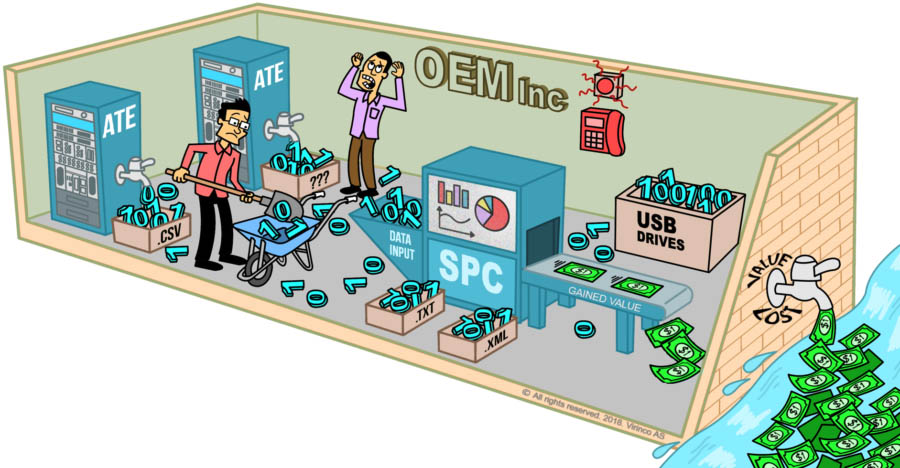
Information Overload with SPC
If you’re using statistical process control to find problems in electronics manufacturing, then because of the complexity of what you are making and all the factors that impact it there are going to be trends, alerts, and warnings on every data set that you look at that will cloud what you really need to see.
False Alarms Everywhere with SPC
Let’s assume you managed to eliminate common cause variations; the next challenge would be how to go about implementing the alarming system.
A tool in Statistical Process Control, developed by Western Electric Company back in 1956, is known as Western Electrical Rules, or WECO. It specifies certain rules where violation justifies investigation, depending on how far the observation is from ranges of standard deviations. One problematic feature of WECO is that it on average will trigger a false alarm every 91,75 measurements.
62 False Alarms Per Day
Let’s say you have an annual production output of 10.000 units. Each gets tested through 5 different processes. Each process has an average of 25 measurements. Combining these you will on average get 62 false alarms per day, assuming 220 working days per year.

Let’s repeat that; assuming you, against all odds and reason, were able to remove common cause variations, you would still be receiving 62 alarms every day. People receiving 62 emails per day from a single source would likely mute them, leaving important announcements unacknowledged, with no follow-up.
SPC savvy users will likely argue that there are ways to reduce this by new and improved analytical methods. However, even if we managed to reduce the number of false alarms to 5 per day, could it represent a strategic alarming system?
The point is that you need test data that you can trust and act on. If you’re told something is wrong incorrectly at every stage of testing, eventually your testers are just going to ignore the notifications they receive. When you’re producing at scale, it takes too much time to investigate each issue if they’re reported more often than needed, and this can also cause backlogs in testing.
The Challenge of Downstream KPIs in SPC
What most manufacturers using SPC do, is to make assumptions on a limited set of important parameters to monitor, and carefully track these by plotting them in their Control Charts, X-mR Charts or whatever they use to try and separate the cliff from the wheat. These KPI’s are often captured and analyzed well downstream in the manufacturing process, often after multiple units are combined into a system.
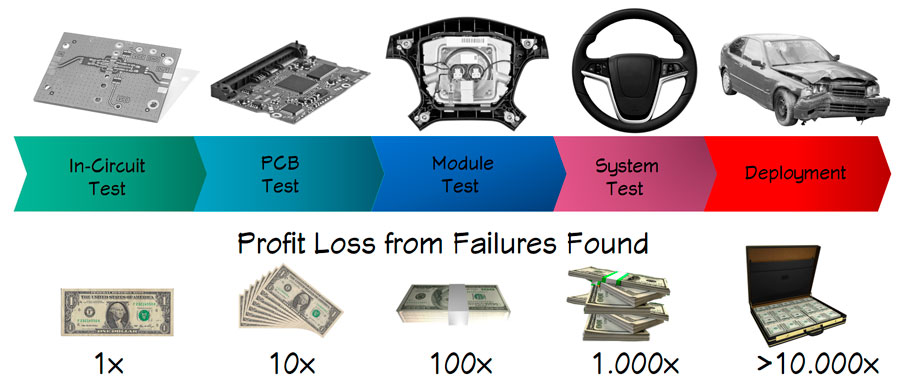
The 10x Cost Rule of Manufacturing
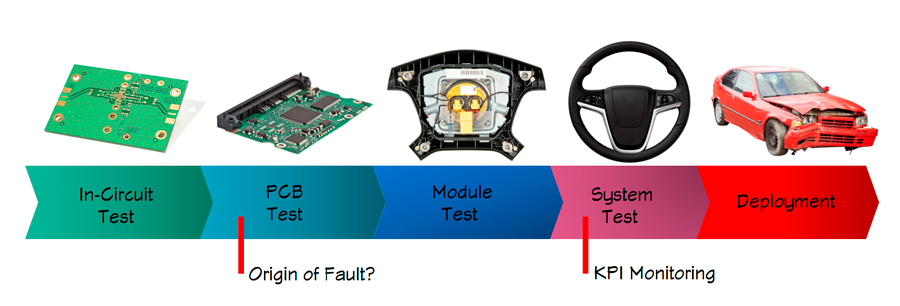
An obvious consequence of analyzing KPIs well downstream in the manufacturing process is that problems are not detected where they happen, as they happen.
The origin could easily come from one of the components upstream, manufactured one month ago in a batch that by now has reached 50.000 units. A cost-failure relationship known as the 10x rule says that for each step in the manufacturing process a failure is allowed to continue, the cost of fixing it increases by a factor of 10. A failure found at the system level can mean that technicians will need to pick apart the product, allowing for new problems to arise.
Should the failure be allowed to reach the field the cost implications can be catastrophic. There are multiple examples from modern times where firms had to declare bankruptcy or protection against such due to the prospect of massive recalls. A well-known case is Takata filing for bankruptcy after a massive recall of airbag components, that may exceed 100 million units.
A Modern Alternative to Statistic Process Control
One of the big inherent flaws of Statistical Process Control, according to standards of modern approaches such as Lean Six Sigma, is that it makes assumptions of where problems are coming from.
This is an obvious consequence of assuming stability in what in reality are highly dynamic factors, as mentioned earlier. Trending and tracking a limited set of KPIs only enhance this flaw. This again kicks off improvement initiatives likely to fail at focusing on your most pressing or cost-efficient issues.
All this is accounted for in modern methods for Quality Management and Test Data Management.
The Single Most Important KPI: True First Pass Yield
In electronics manufacturing, this starts with an honest recognition and monitoring of your First Pass Yield (FPY) or to be more precise: your True First Pass Yield. By True, it means that any kind of failure must be accounted for, even if it only came from the test operator forgetting to plug in a cable. Every test after the first represents waste, resources the company could have spent better elsewhere. FPY represents your single most important KPI, still, most OEMs have no real clue what theirs is.
Real-time Dashboards
Knowing your First Pass Yield, you can break this down parallel across different products, product families, factories, stations, fixtures, operators, and test operations. Having this data available in real-time as Dashboards gives you a powerful overview. It lets you quickly drill down to understand the real origin of poor performance and make informed interventions. Allocating this insight as live dashboards to all involved stakeholders also contributes to enhanced quality accountability.
Real-Time Dashboards and drill-down capabilities allow you to quickly identify the contributors to poor performance. Here is it apparent that Product B has a single failure contributing to around 50% of the waste. There is no guarantee that Step 4 is included in monitored KPIs within an SPC system, but it is critical that the trend is brought to your attention. A good rule of thumb for the dashboard is that it won’t act on it unless the information is given to you. We don’t have time to go looking for trouble.
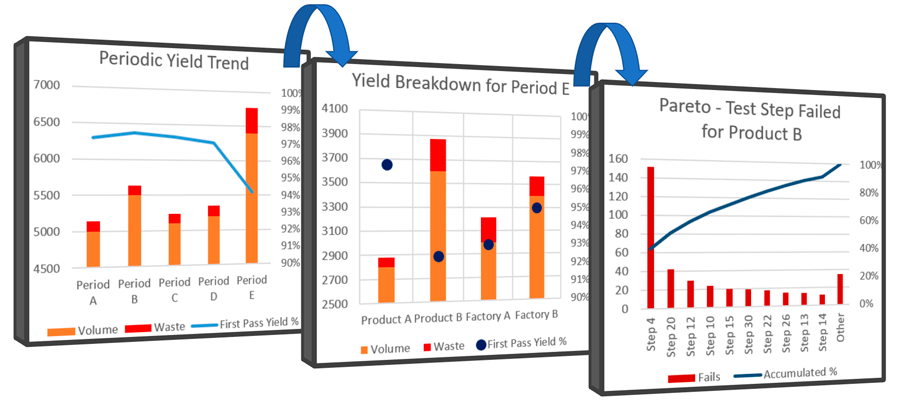
Quickly Drill-down to a Pareto View
As a next step, you must be able to quickly drill down to a Pareto view of your most occurring failures across any of these dimensions. By now, it could very well be that SPC tools become relevant to learn more details. But now you know that you are applying it on something of high relevance, not based on educated guesses. You suddenly find yourself in a situation where you can prioritize initiatives based on a realistic cost-benefit ratio.
The Importance of Repair Data
The presence of repair data in your system is also critical, and it cannot exclusively contain in an MES system. Amongst other benefits, repair data supplies contextual data that improves root-cause analysis. From a human-resource point of view, it can also tell you if products are blindly retested, as sometimes normal process variations measure within the pass-fail limits. Or if the product is taken out of the standard manufacturing line and fixed as intended.
In short, quality influencing actions come from informed decisions. Unless you have a data management approach that can give you the complete picture across multiple operational dimensions, you can never optimize your product and process quality or company profits.
In the end: You can’t fix what you don’t measure. And things we measure tends to improve.
