Do you use Microsoft Power BI for data reporting?
Do you need a data dashboard for manufacturing test performance, such as First Pass Yield, Overall Equipment Effectiveness (OEE), or Test Asset maintenance status in Power BI?
WATS is for you.
How about a dashboard that combines key performance indicators from production testing with other data sources, such as an ERP or MES system, or RMA Ticket System?
WATS is for you too.
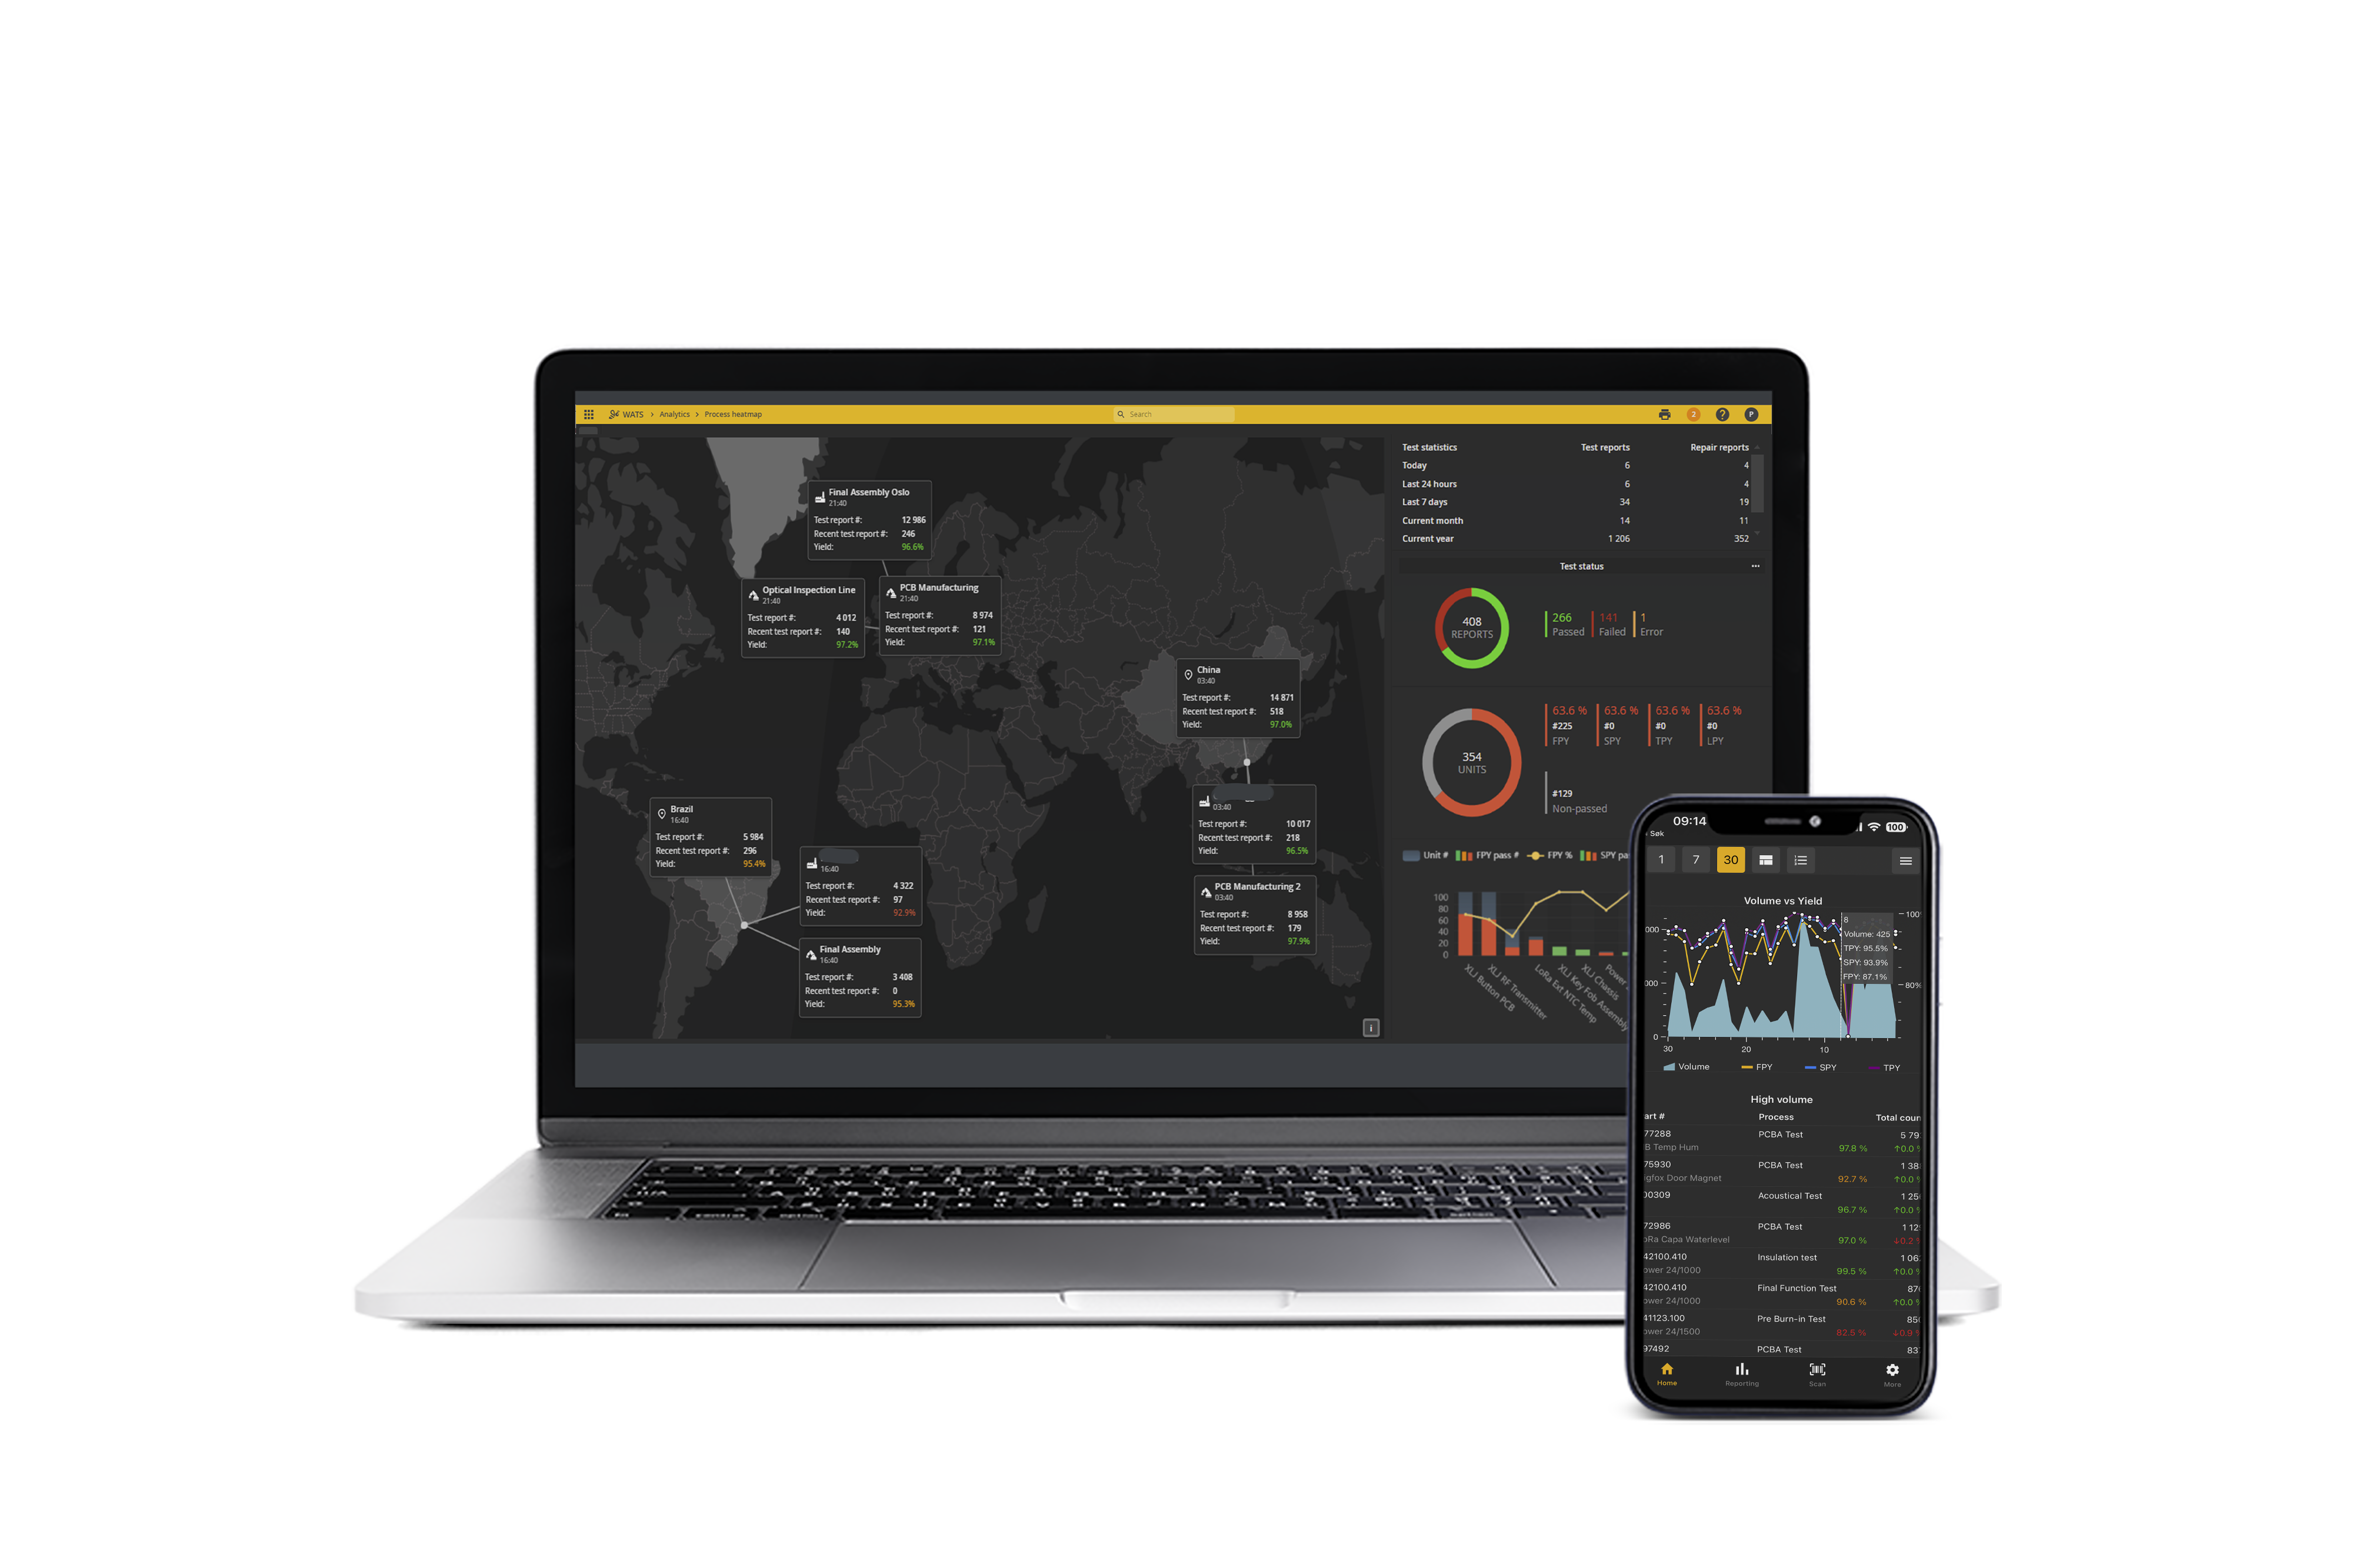
WATS Power BI Dashboard for Test Data Management is built to monitor electronics production.
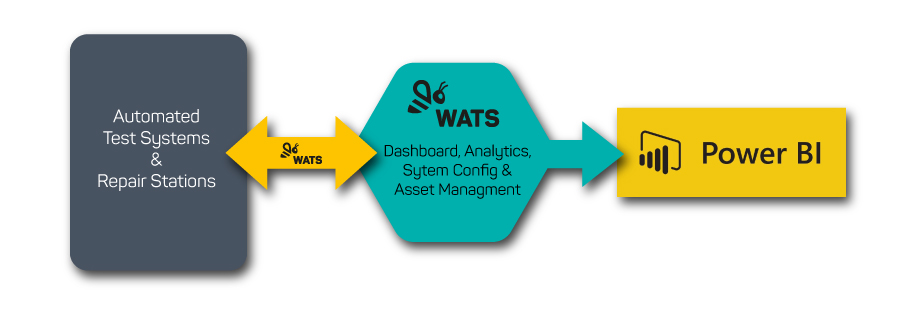
WATS integrates seamlessly with Power BI, providing unrivalled flexibility and scalability for bringing your factory-level test system data to an Enterprise level for visual reporting.
The Power BI extension is even available with the Free version of WATS.

This Power BI Dashboard easily allows you to report metrics such as True First Pass Yield metrics, yield trends per product, production volumes, and worst-yield products. And then also combine the visual widgets in PowerBI with widgets from other manufacturing information solutions such as ERP or MES systems.
The Power BI extension represents our commitment to tighter integration with Enterprise Software, Artificial Intelligence, and Advanced Data Visualization.
Power BI is a strategic integration in WATS.
Microsoft Power BI is the leading platform for Analytics and Business Intelligence. A position it has held for 12 consecutive years at Gartner’s Magic Quadrant.
“Microsoft is investing in a broad set of visionary capabilities and integrating them with Power BI. Investments include enhancements to augmented analytics and making new AutoML features available in Azure Machine Learning. Azure cognitive services, such as text, sentiment and image analytics and AI, will also be available through Power BI for use by people with minimal data science skills, among many others.”
Gartner Magic Quadrant Report
You can access the dashboard today and download it from Microsoft AppSource. It’s that easy.


